This Special Topic zooms in on the possible trade-off between employment and productivity growth in the EU, focusing on the role of composition effects. The past decade has been characterised by sustained employment growth combined with a mild slowdown in labour productivity growth. The analysis suggests that workforce composition changes have likely not contributed to the productivity slowdown, as the employed population has become progressively more educated and experienced. Likewise, the reallocation of employment across sectors had little impact, positive or negative, on productivity growth. Instead, most of the productivity dynamics appear to be driven by intra-sector dynamics, underscoring the role of sluggish investment amid strong employment growth and restrained wage increases. Additionally, the slowdown can be attributed to weaker total factor productivity growth, stemming from reduced technological diffusion and a decline in innovation performance ([1]).
| Graph II.2.1: Average employment and productivity growth in 2002-2013 and 2013-2023, EU |
 |
In the last decade, strong employment growth has coincided with a further slowdown in productivity growth in the EU. Between 2002 and 2013, employment increased by 0.3% on average every year, while labour productivity (real value added per employee) grew by 0.8% (Graph II.2.1). In terms of hours, employment growth was even more sluggish with almost no change in the total of hours worked between 2002 and 2013 (0.02% on average per year), supporting productivity growth (1.1%). These trends contrast with the more recent developments between 2013 and 2023. In this period, employment grew at an average rate of 1.1%, while productivity growth per employed person slowed down to an average of 0.6% - with much of the slowdown due to the contraction of productivity in 2023. In hourly terms, employment and productivity growth averaged at 0.9% and 0.8%, respectively. Such prima facie aggregate evidence raises the following question: is there a trade-off between employment growth and productivity growth? And to what extent can the higher job-intensity of growth between 2013 and 2023 explain the slowdown in productivity?
Economic theory suggests that there could be a trade-off on aggregate between increased employment and productivity growth. A supply-driven increase in employment (e.g. linked to increased labour market participation) reduces the capital to labour ratio, driving labour productivity down. If investment responds quickly to changes in employment and the associated increase in the marginal productivity of capital, then the trade-off between labour market participation and productivity will be short-lived. However, if adaptation of capital is slow, then the trade-off effect is more persistent. In addition, employment growth may also contribute to changes in productivity growth insofar as the individual characteristics of new entrants are different from those of incumbent workers. For example, if employment growth is biased towards workers with lower skills than the rest of the employed population, the impact on aggregate productivity will be negative. Finally, sectoral composition effects may also play a role: in case employment growth is biased towards sectors with low productivity (either in levels or growth rates), this may imply a drag on aggregate productivity growth.
Empirical evidence confirms that employment and productivity growth on aggregate move in different directions, although the trade-off is often short-lived. Dew-Becker and Gordon (2008) use data on selected EU Member States in the period 1995-2006 to analyse the drivers of productivity growth. ([2]) Their results suggest that - in addition to weak growth of capital investment - also composition effects in terms of demographics played a role. The negative relationship between employment and productivity growth is confirmed by Marelli and Signorelli (2010), with findings that are in line with previous results by McGuckin and van Ark (2005). ([3]) Based on aggregate data on 36 OECD countries in the period 1970-2002, they find a negative elasticity of productivity to employment (less than 0.3 depending on the country). The effect is, however, short-lived (less than 5 years), suggesting the importance of capital adjustment. The importance of controlling for other factors is also underlined by Tang (2015). ([4]) Based on a sample of 24 OECD countries in the period 1970-2009, he finds that although at the aggregate level employment growth is negatively correlated with labour productivity growth, the negative relation disappears after controlling for other factors such as capital intensity, labour quality and industry structure.
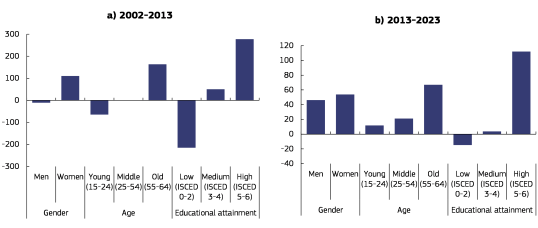
Employment growth in the EU in the last decade coincided with an increase in the share of women, older workers and highly educated workers. Graph II.2.2 presents the composition of the cumulative net employment growth by gender, age and education for the periods 2002-2013 (Panel a) and 2013-2023 (Panel b). The contribution of workers with these three characteristics is expressed as a percentage of the cumulative total employment growth. The growing contribution of female employment reflects a long-term trend, but is particularly visible in the period 2002-2013. In that period, which covers the euro area sovereign crisis, more than 7 million women entered employment, whereas male employment contracted by more than 700 000 individuals ([5]). In contrast, in the subsequent years (2013-2023) the contribution by gender was more balanced. The effects of the ageing of the working age population are visible in both time periods with especially older workers contributing to employment growth. Nevertheless, while for the period 2002-2013 younger workers appear to have been negatively affected by the crisis period, subsequently their contribution turned positive, but below that of middle-aged and especially older workers. Finally, across both time periods new entrants in employment are more likely to be tertiary educated, whereas the share of those with low educational attainment declined.
| Graph II.2.2: Composition of employment growth in the EU27 |
 |
Under the assumption that relative wages reflect relative productivities, it is possible to gauge the impact of changes in the composition of the individual characteristics of the workers in employment on productivity ([6]). The methodology used is based on the logic behind an Oaxaca-Blinder decomposition and consists of two steps. In a first step, for each country a Mincerian wage equation is estimated using individual data from the Structure of Earnings Survey pooled for the years 2002 and 2018 (latest available year) ([7]). These linear estimations, with the natural logarithm of the average hourly wage as the dependent variable and individual characteristics as independent variables, allow to assess how individual characteristics such as age, gender and educational attainment ([8]) ([9]) affect wage levels. In a second step, the coefficients from the pooled regression for 2002 and 2018 are multiplied by the changes in the individual characteristics of employees from the Labour Force Survey between 2002-2013 and 2013-2023 to obtain the compositional effect up to 2023 ([10]). The bars in Graph 3 represent the average hourly wage growth due to the contribution of the change in each individual characteristic in the periods 2002-2013 and 2013-2023 ([11]).
| Graph II.2.3: Impact of changes in employment composition on average wage growth in 2002-2013 and 2013-2023, EU27 |
 |
Changes in the composition of the workforce in terms of educational attainment and age had the strongest impact on wages and therefore productivity. Unsurprisingly, higher levels of educational attainment in the workforce are significantly and strongly associated with higher wages. The same holds for ageing, which usually comes with increasing levels of experience. On average, over the 21 countries included in the sample (See footnote 38), the higher level of educational attainment induced an increase in average hourly wages of 5.8% and 3.6% in the period 2002-2013 and 2013-2023, respectively. The impact of ageing on average hourly wages is smaller, at 1.8% and 0.5%. Gender appears to have a very mild negative association with wages per se, after taking into account other factors (-0.4% for both periods combined).
| Graph II.2.4: Change in share in total labour input and in real labour productivity in EU27 between 2002 and 2022 |
 |
| (1) Sectors with employment share below 1% are excluded |
The impact of changes in the composition of the work force on wages and therefore productivity is overall positive, though the impact is likely to have been stronger in the first sub-period. This likely reflects the effect of the crisis period that hit the EU labour market in the beginning of the 2010s, displacing vulnerable workers, including young and low-skilled people (Anderton et al. 2015). Overall, the composition of the workforce likely played some positive effect on productivity leading up to 2013, especially in light of a trend towards a growing incidence of aged and skilled workforce, and counter-cyclical composition effects.
In addition to individual characteristics, also sectoral reallocation dynamics may affect productivity developments. Employment growth in the EU since 2002 has been generally stronger in sectors characterised by relatively low labour productivity growth (Graph II.2.4). The share of EU employment in services, typically exhibiting relatively low productivity growth, rose from about 65% in 2002 to more than 73% in 2022. This is expected in light of the so-called Baumol effect - whereby the potential for labour saving linked to productivity growth is weaker in labour-intensive sectors like services. Overall, sectors where relative employment grew strongly, like Health and Social Work (Q), Professional services (M) and Administrative and support services (N), exhibited particularly low productivity growth, while productivity dynamics are relatively strong in the shrinking agriculture and manufacturing sectors. The ICT services sector is a notable exception since it couples strong productivity growth with an increase in employment.
| Graph II.2.5: Decomposition of annual aggregate labour productivity growth |
 |
| Note: Decomposition performed at NACE 1-digit level. |
Aggregate productivity growth is affected by resource allocation between sectors with different productivity levels and productivity growth. Over time, the composition of economic sectors — measured by employment or value-added share — shifts due to structural changes and sector-specific shocks. Since sectors vary in productivity levels and growth rates, these shifts can drive overall productivity trends. To assess how much sectoral reallocation affects aggregate productivity, a shift-share analysis is used, breaking down productivity growth into three components:
- The within-industry effect, reflecting productivity growth within each sector, assuming constant sector shares;
- The structural shift effect, capturing productivity growth from changes in sectoral employment shares, with productivity within each sector held constant;
- The structural interaction effect, which combines the effects of productivity growth with changes in employment shares across sectors.
The structural shift effect, typically positive, arises when labour moves from low-productivity to higher-productivity sectors, though its impact tends to be temporary, tapering once resource reallocation stabilises. Meanwhile, the structural interaction effect, often more persistent and negative (as in the Baumol effect), reflects labour shifts into sectors with slower productivity growth. Graph II.2.5 presents the above-described decomposition of aggregate productivity growth for the EU and the euro area ([12]). Aggregate productivity growth is broken down into (i) a within-sector effect (blue bar); (ii) the structural shift effect (yellow); and (iii) the structural interaction effect (red) ([13]).
Between 2002 and 2022, cross-sector re-allocations of labour had a marginal impact on total economy productivity growth. Aggregate growth in labour productivity (per hour worked) is primarily driven by intra-sector productivity dynamics (blue bar), which holds for all EU countries. Labour re-allocations between industries with different productivity levels (yellow) tend to have a positive impact on total economy productivity, while the reverse is true for re-allocations between industries with different productivity growth rates (Baumol effect, red).
· The positive effect of re-allocations between industries with different productivity levels was typically stronger for countries exhibiting transition dynamics like Poland, Romania and Bulgaria, thereby resulting in EU productivity being driven to a stronger extent by these effects than the euro area aggregate.
Over the full period 2002-2022, the positive and negative re-allocation effects roughly cancel out, both amounting to about 1/4th of the aggregate productivity growth rate (average) of 1.3%.There is a reduction in importance of the re-allocation effects over time (both on growth and level), likely linked to the fact that labour reallocations were relatively stronger over the period 2002-2013 compared with 2013-2022, among others in the manufacturing industry.
This suggests that weakening productivity growth is rooted in slow investment growth and faltering total factor productivity. The fact that the slowdown in productivity growth has been driven primarily by intra-sector dynamics points to the role of weakening capital intensity and slower total factor productivity growth. Obstacles to investment growth have compounded with weak incentives for capital-intensive modernisation, in the context of the subdued wage pressures that followed the great financial crisis. Investment in information and communication technology (ICT) and research and development (R&D), in particular, has not kept pace with that of the EU’s main competitors. Additionally, TFP growth, the core driver of productivity, has weakened significantly due to slower technological diffusion and declining innovation rates. Empirical evidence has pointed also to the role of weak reallocation of capital and labour across firms within the same sector, which may have constrained the growth potential of high-performing firms and the productivity-enhancing effects of technology.
Footnotes
([1]) For an overview of the key drivers behind the slowdown in productivity growth in the EU, see European Commission (2023). Euro area competitiveness: State of play, challenges and trade-offs for policy, Technical note for the Eurogroup, October.
([2]) Dew-Becker, I. and R. Gordon (2008). The Role of Labor Market Changes in the Slowdown of European Productivity Growth. National Bureau of Economic Resaerch (NBER) Working Paper No. 13840, Cambridge.
([3]) Marelli, E. and M. Signorelli (2010). "Employment, productivity and models of growth in the EU," International Journal of Manpower 31(7): 732-754; McGuckin, R. and B. van Ark (2005). "Productivity and participation: an international comparison," Groningen Growth and Development Centre Research Memorandum 200578, Groningen.
([4]) Tang, J. (2015). "Employment and Productivity: Exploring the Trade-off," International Productivity Monitor, Centre for the Study of Living Standards 28: 63-80.
([5]) This evidence confirms that men are disproportionally affected by job losses in crisis periods (Anderton et al. 2015; Botelho and Neves, 2021). Anderton, R. et al. (2015), “Comparisons and contrasts of the impact of the crisis on euro area labour markets” ECB Occasional Paper 159, European Central Bank, Frankfurt; Botelho, V. and P. Neves (2021). “The impact of the COVID-19 crisis on the euro area labour market for men and women” ECB Economic Bulletin Issue 4/2021, European Central Bank, Frankfurt.
([6]) Note that there may be caveats in relation to this assumption. For example, differences in the bargaining power of both firms and workers may result in deviations of the (individual) wage and the marginal productivity of the worker. Furthermore, it could be argued that this analysis presents only a part of the total impact that changes in the composition of employment may have on productivity, as wage developments concern only employees and not self-employed.
([7]) The Member States included in the analysis are Belgium, Bulgaria, Czechia, Estonia, Germany, Greece, Spain, France, Italy, Cyprus, Latvia, Lithuania, Luxembourg, Hungary, Netherlands, Poland, Portugal, Romania, Slovakia, Finland and Sweden. For Germany, data refer to 2006 instead of 2002 due to data availability. The sample includes employees from the following sectors: mining (B), industry (C-E), construction (F) and services (G-N)). Salaried workers in the public sector are excluded due to missing data on public employees in several Member States.
([8]) The independent variables included are all categorical variables, with the following categories: 6 categories for age (14-19, 20-29, 30-39, 40-49, 50-59, 60+), 2 categories for gender (men and women) and 3 categories for educational attainment (ISCED 0-2, ISCED 3-4, ISCED 5+).
([9]) The changes in the share of each covariate obtained from the Labour Force Survey relate to employees from the private and public sector. The underlying assumption is that the the returns associated with the individual characteristics for the private sector, as estimated in the first step, are the same for the public sector. To test the validity of this assumption, the same analysis is performed limiting the second step only to private employees. The results of this robustness check are similar to the baseline results for which both private and public employees are included and are available upon request. In addition, also controlling for the sector of employment or the type of contract does not significantly affect the results.
([10]) In an Oaxaca-Binder decomposition the “explained or composition effect” measures the change in the wage growth due to changes in the composition of the workforce in terms of individual characteristics, while keeping the return associated with these characteristics unchanged. In the first step of the analysis, wages in time period T () are regressed on a number of individual characteristics () (age, educational and gender) and a time dummy () ((). To obtain the composition effect, the coefficients from this regression are then multiplied by the changes in the share of each covariate in the salaried work force obtained from the Labour Force Survey ( The composition effect can be further broken down in the detailed contributions of each predictor or with , ,.. the means of the single regressors and , … the associated coefficients. There may be caveats to this approach. For example, unobserved characteristics of new entrants, such as past labour market experience, may bias the results as they may also affect the returns to the individual characteristics (the ’s), which are based on the stock of workers in 2002 and 2018.
([11]) The EU average effect is calculated as the unweighted average of the compositional effects by Member State.
([12]) The methodology is developed in Tang, J. and W. Wang (2004). “Sources of aggregate labour productivity growth in Canada and the Unites States” Canadian Journal of Economics 37 (2), 421-444. For an application of the Tang and Wang (2004) methodology on EU countries see, e.g., the annual report (2022) of the Belgian National Productivity Board.
([13]) This decomposition can be expressed as , where is productivity growth, is a weight that captures the share of sector in nominal value added at the start (in ), is productivity of sector at the start, and is the change in the sector’s relative size (which is measured as the share of labour adjusted by relative prices). The decomposition was performed for twenty sectors defined at the one-digit level of disaggregation.